| Valgrind User Manual |
|---|
| Valgrind User Manual |
|---|
Table of Contents
To use this tool, you must specify
--tool=massif on the Valgrind
command line.
Massif is a heap profiler, i.e. it measures how much heap memory programs use. In particular, it can give you information about:
Heap blocks;
Heap administration blocks;
Stack sizes.
Heap profiling is useful to help you reduce the amount of memory your program uses. On modern machines with virtual memory, this provides the following benefits:
It can speed up your program -- a smaller program will interact better with your machine's caches and avoid paging.
If your program uses lots of memory, it will reduce the chance that it exhausts your machine's swap space.
Also, there are certain space leaks that aren't detected by traditional leak-checkers, such as Memcheck's. That's because the memory isn't ever actually lost -- a pointer remains to it -- but it's not in use. Programs that have leaks like this can unnecessarily increase the amount of memory they are using over time.
Everybody knows how useful time profilers are for speeding up programs. They are particularly useful because people are notoriously bad at predicting where are the bottlenecks in their programs.
But the story is different for heap profilers. Some programming languages, particularly lazy functional languages like Haskell, have quite sophisticated heap profilers. But there are few tools as powerful for profiling C and C++ programs.
Why is this? Maybe it's because C and C++ programmers must
think that they know where the memory is being allocated. After
all, you can see all the calls to
malloc() and
new and
new[], right? But, in a big
program, do you really know which heap allocations are being
executed, how many times, and how large each allocation is? Can
you give even a vague estimate of the memory footprint for your
program? Do you know this for all the libraries your program
uses? What about administration bytes required by the heap
allocator to track heap blocks -- have you thought about them?
What about the stack? If you are unsure about any of these
things, maybe you should think about heap profiling.
Massif can tell you these things.
Or maybe it's because it's relatively easy to add basic heap profiling functionality into a program, to tell you how many bytes you have allocated for certain objects, or similar. But this information might only be simple like total counts for the whole program's execution. What about space usage at different points in the program's execution, for example? And reimplementing heap profiling code for each project is a pain.
Massif can save you this effort.
First off, as for normal Valgrind use, you probably want to
compile with debugging info (the
-g flag). But, as opposed to
Memcheck, you probably do want to turn
optimisation on, since you should profile your program as it will
be normally run.
Then, run your program with valgrind
--tool=massif in front of the normal command
line invocation. When the program finishes, Massif will print
summary space statistics. It also creates a graph representing
the program's heap usage in a file called
massif.pid.ps, which can be read by any
PostScript viewer, such as Ghostview.
It also puts detailed information about heap consumption in
a file massif.pid.txt (text format) or
massif.pid.html (HTML format), where
pid is the program's process id.
To gather heap profiling information about the program
prog, type:
% valgrind --tool=massif prog
The program will execute (slowly). Upon completion, summary statistics that look like this will be printed:
==27519== Total spacetime:   2,258,106 ms.B
==27519== heap:              24.0%
==27519== heap admin:         2.2%
==27519== stack(s):          73.7%
All measurements are done in spacetime, i.e. space (in bytes) multiplied by time (in milliseconds). Note that because Massif slows a program down a lot, the actual spacetime figure is fairly meaningless; it's the relative values that are interesting.
Which entries you see in the breakdown depends on the command line options given. The above example measures all the possible parts of memory:
Heap: number of words allocated on the heap, via
malloc(),
new and
new[].
Heap admin: each heap block allocated requires some administration data, which lets the allocator track certain things about the block. It is easy to forget about this, and if your program allocates lots of small blocks, it can add up. This value is an estimate of the space required for this administration data.
Stack(s): the spacetime used by the programs' stack(s). (Threaded programs can have multiple stacks.) This includes signal handler stacks.
As well as printing summary information, Massif also
creates a file representing a spacetime graph,
massif.pid.hp. It will produce a file
called massif.pid.ps, which can be viewed in
a PostScript viewer.
Massif uses a program called
hp2ps to convert the raw data
into the PostScript graph. It's distributed with Massif, but
came originally from the
Glasgow Haskell
Compiler. You shouldn't need to worry about this at all.
However, if the graph creation fails for any reason, Massif will
tell you, and will leave behind a file named
massif.pid.hp, containing the raw heap
profiling data.
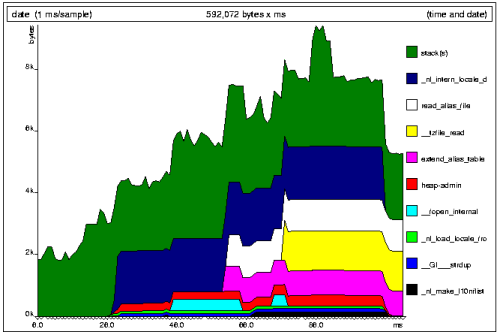
Here's an example graph:
The graph is broken into several bands. Most bands represent a single line of your program that does some heap allocation; each such band represents all the allocations and deallocations done from that line. Up to twenty bands are shown; less significant allocation sites are merged into "other" and/or "OTHER" bands. The accompanying text/HTML file produced by Massif has more detail about these heap allocation bands. Then there are single bands for the stack(s) and heap admin bytes.
Note: it's the height of a band that's important. Don't let the
ups and downs caused by other bands confuse you. For example,
the read_alias_file band in the
example has the same height all the time it's in existence.
The triangles on the x-axis show each point at which a memory census was taken. These aren't necessarily evenly spread; Massif only takes a census when memory is allocated or deallocated. The time on the x-axis is wallclock time, which is not ideal because you can get different graphs for different executions of the same program, due to random OS delays. But it's not too bad, and it becomes less of a problem the longer a program runs.
Massif takes censuses at an appropriate timescale; censuses take place less frequently as the program runs for longer. There is no point having more than 100-200 censuses on a single graph.
The graphs give a good overview of where your program's space use comes from, and how that varies over time. The accompanying text/HTML file gives a lot more information about heap use.
The text/HTML file contains information to help interpret the heap bands of the graph. It also contains a lot of extra information about heap allocations that you don't see in the graph.
Here's part of the information that accompanies the above graph.
== 0 ===========================
Heap allocation functions accounted for 50.8% of measured spacetime
Called from:
The first part shows the total spacetime due to heap
allocations, and the places in the program where most memory was
allocated (Nb: if this program had been compiled with
-g, actual line numbers would be
given). These places are sorted, from most significant to least,
and correspond to the bands seen in the graph. Insignificant
sites (accounting for less than 0.5% of total spacetime) are
omitted.
That alone can be useful, but often isn't enough. What if
one of these functions was called from several different places
in the program? Which one of these is responsible for most of
the memory used? For
_nl_intern_locale_data(), this
question is answered by clicking on the
22.1% link, which takes us to the
following part of the file:
== 1 ===========================
Context accounted for 22.1% of measured spacetime
 0x401767D0: _nl_intern_locale_data (in
/lib/i686/libc-2.3.2.so)
Called from:
22.1%: 0x40176F95: _nl_load_locale_from_archive (in /lib/i686/libc-2.3.2.so)
At this level, we can see all the places from which
_nl_load_locale_from_archive()
was called such that it allocated memory at 0x401767D0. (We can
click on the top 22.1% link to go back
to the parent entry.) At this level, we have moved beyond the
information presented in the graph. In this case, it is only
called from one place. We can again follow the link for more
detail, moving to the following part of the file.
== 2 ===========================
Context accounted for 22.1% of measured spacetime
 0x401767D0: _nl_intern_locale_data (in
/lib/i686/libc-2.3.2.so)
0x40176F95: _nl_load_locale_from_archive (in /lib/i686/libc-2.3.2.so)Called from:
In this way we can dig deeper into the call stack, to work
out exactly what sequence of calls led to some memory being
allocated. At this point, with a call depth of 3, the
information runs out (thus the address of the child entry,
0x40176184, isn't a link). We could rerun the program with a
greater --depth value if we
wanted more information.
Sometimes you will get a code location like this:
30.8% : 0xFFFFFFFF: ???
The code address isn't really 0xFFFFFFFF -- that's impossible. This is what Massif does when it can't work out what the real code address is.
Massif produces this information in a plain text file by
default, or HTML with the
--format=html option. The plain
text version obviously doesn't have the links, but a similar
effect can be achieved by searching on the code addresses. (In
Vim, the '*' and '#' searches are ideal for this.)
The information should be pretty accurate. Some approximations made might cause some allocation contexts to be attributed with less memory than they actually allocated, but the amounts should be miniscule.
The heap admin spacetime figure is an approximation, as described above. If anyone knows how to improve its accuracy, please let us know.
Massif-specific options are:
--heap=<yes|no> [default: yes]
When enabled, profile heap usage in detail. Without it, the
massif.pid.txt or
massif.pid.html will be very short.
--heap-admin=<number> [default: 8]
The number of admin bytes per block to use. This can only
be an estimate of the average, since it may vary. The allocator
used by glibc requires somewhere
between 4 to 15 bytes per block, depending on various factors. It
also requires admin space for freed blocks, although
massif does not count this.
--stacks=<yes|no> [default: yes]
When enabled, include stack(s) in the profile. Threaded programs can have multiple stacks.
--depth=<number> [default: 3]
Depth of call chains to present in the detailed heap
information. Increasing it will give more information, but
massif will run the program more slowly,
using more memory, and produce a bigger
massif.pid.txt or
massif.pid.hp file.
--alloc-fn=<name>
Specify a function that allocates memory. This is useful
for functions that are wrappers to malloc(),
which can fill up the context information uselessly (and give very
uninformative bands on the graph). Functions specified will be
ignored in contexts, i.e. treated as though they were
malloc(). This option can be specified
multiple times on the command line, to name multiple
functions.
--format=<text|html> [default: text]
Produce the detailed heap information in text or HTML
format. The file suffix used will be either
.txt or .html.